
The absence of LMS reporting and analytics is often a deal breaker for large customers. Without such features, it’s impossible to calculate the ROI for education programs. So all major players invest in data-driven features.
Take, for example, the popular Moodle LMS. It synthesizes data from various sources, such as analytics and software performance. It then provides all sorts of reports for learners and administrators. Beyond the traditional LMS, Udemy uses EdTech data to improve learning outcomes. Course creators can assess how students are engaging with their content. They can then improve courses and personalize learning.
As a software development company, MindK deals with analytics on almost every project – from data-driven ad management to sustainability reporting. We know firsthand that analytics can help you address a wide range of EdTech challenges and opportunities.
Table of contents:
- Benefits of LMS reporting and analytics
- Types of data you want to track with LMS analytics
- Components of eLearning analytics
- How to implement education analytics
- Why choose Mindk for custom LMS development
Benefits of LMS reporting and analytics
There are two main reasons why data analytics add value to eLearning software.
Improving key business metrics
eLearning startups like Tyoch Learning search for ways to acquire users, improve sales, and raise profit margins. We helped them build a platform for professional coaches, businesses, and individuals. It features an intuitive course builder, result assessments, personalized course recommendations, and a dashboard for tracking student progress.
Here’s how eLearning data analytics can help companies like Tyoch Learning:
- Identify popular content to attract users.
- Find cross-selling opportunities to improve revenue.
- Optimize pricing strategies to raise profit margins.
- Reduce churn to improve Customer Lifetime Value (CLV).
- Improve learner experience to beat competitors.
Source: Udemy analytics
Bettering the learning outcomes
Both educators and businesses want to promote relevant skills and knowledge among employees. Take, for example, CEMAsys – a leading Corporate Social Responsibility (CSR) company from Norway. Their mission is to help businesses reduce carbon emissions.
For this purpose, they develop CSR courses and sell them to various businesses.
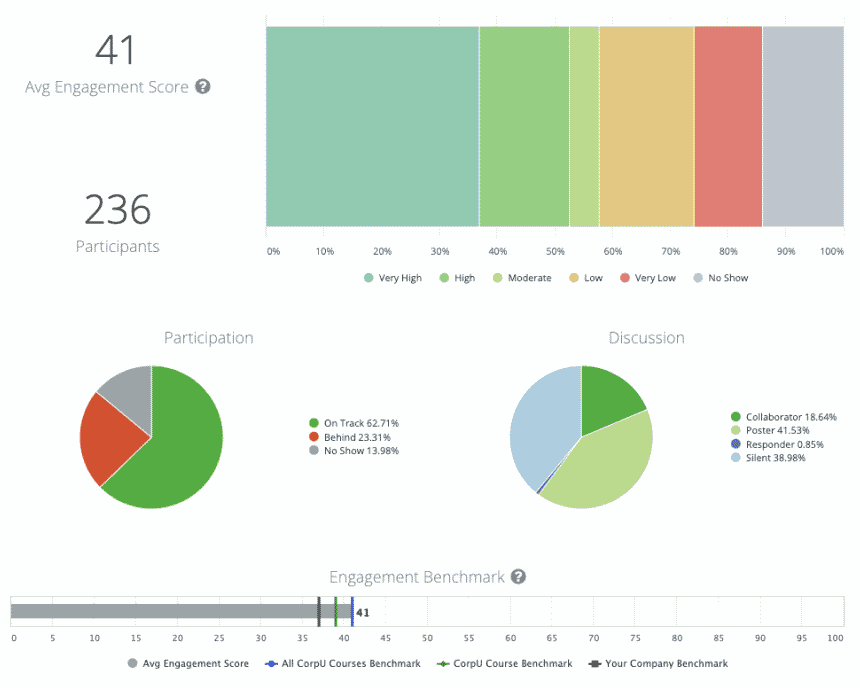
Thanks to eLearning analytics, HR managers then track employee progress on sustainability topics like carbon footprint and energy regeneration. They can track the understanding of specific topics across a whole sequence of courses.
Learning personalization is a very powerful use for LMS data analytics. In 2020, Researchers at the University of Pennsylvania assessed the impact of personalized visualization. They saw a 13.9% increase in course completion, a 14.7% raise in math scores, and a 10.26% improvement in satisfaction.
Assessing the learner’s knowledge can go beyond tracking completion statuses and quiz scores. You can also monitor actions like pages viewed, videos watched, skipping parts of a lesson, muting the sound, or moving the mouse. Seeing exactly where your learners struggle can help you improve courses and lessons.
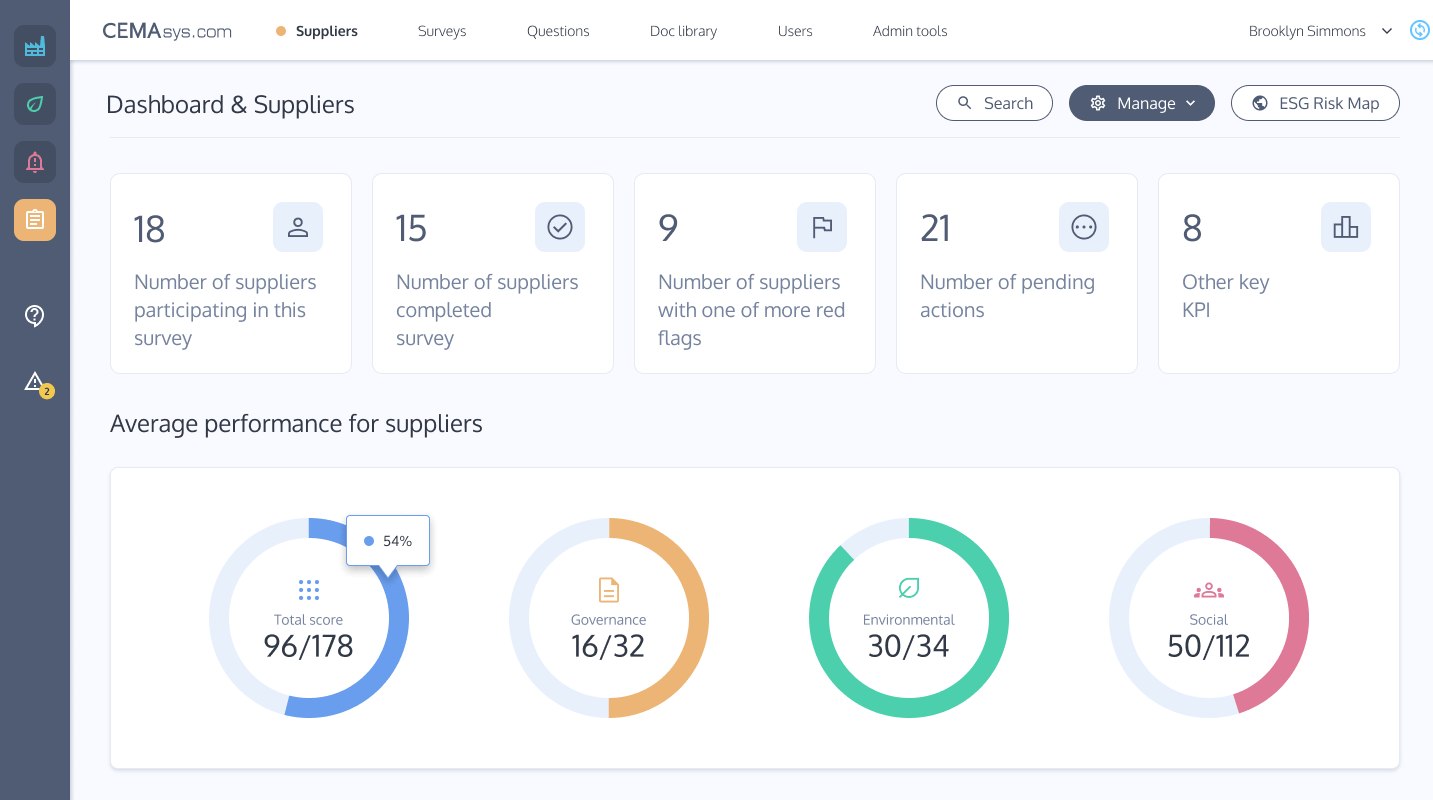
Analytics in CEMAsys application built by MindK [case study]
Types of data you want to track with LMS analytics
eLearning data falls into two broad categories: user engagement and learning success metrics.
User engagement metrics
This data can help you identify popular content topics, track learner interest throughout the lesson, detect difficulties, and craft a more engaging experience.
- Learner search data.
- Time spent on the platform.
- Session number and time.
- Interactions with content.
- User retention metrics.
- Social interactions.
Learning success metrics
Analytics can help you understand short- and long-term effectiveness of your courses. Track progress in real-time, craft personalizing learning journeys, help users set goals, provide granular feedback, and improve lessons to achieve better results.
- Completion rate of courses, modules, or specific lessons.
- Time spent learning.
- Knowledge acquisition and assessment performance.
- Knowledge retention over time.
- Learning path effectiveness
- Accessibility metrics.
Components of eLearning analytics
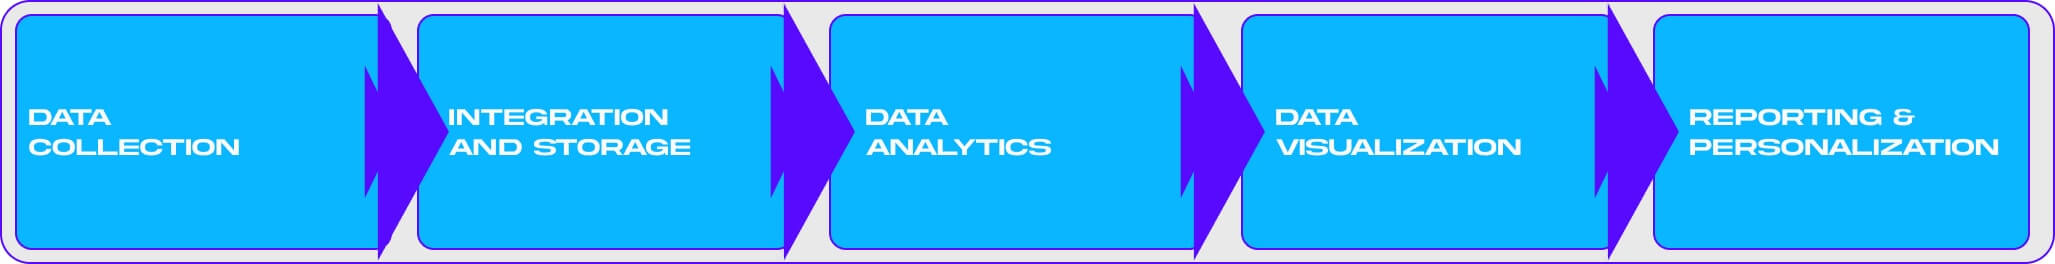
1. Data collection
To support analytics, your software might collect a wide range of data from different sources. These data points can range from simple interactions such as logins and clicks. They can also include complex metrics like time spent on activities, assessment scores, and learner feedback.
Most EdTech companies use industry-standard data collection protocols:
- SCORM (Sharable Content Object Reference Model)
- xAPI (Experience or Tin Can API).
- cmi5 (Computer Managed Instruction).
The choice depends mainly on your project requirements. For example, SCORM is a great option for structured course data without much detail.
xAPI allows tracking and recording a wider range of experiences across various platforms and devices. It’s great for those who need to collect a lot of learning data. Especially if this data is more important than course content.
cmi5 extends SCORM with additional capabilities. The standard is yet to reach popularity, so relatively few tools fully support cmi5. It suits larger companies that already have structured data and need to get maximum course usage information.
2. Data storage
Learning Record Store (LRS) is a specialized tool for easy collecting, storing, and retrieving xAPI statements. It’s centralized storage for all sorts of learning data. It can come from a variety of sources – real-world activities, mobile & desktop apps, HR systems, and so on. We recommend LRS for most of our eLearning customers
Data warehouses integrate heterogeneous data from various sources – LMS, CRM, ERP, Human Resource Information Systems (HRIS), and so on. This solution isn’t for everyone but can provide huge benefits in the right situation. One of our clients had more than a dozen internal and external systems. They all used different technologies and data formats. Building a data warehouse not only connected all of these components. It also made it 10x faster to integrate any future components.
3. Data analytics
Descriptive analytics uses all of the available data to make the most accurate description of the current situation. 72% of Nottingham Trent University students report that such analytics inspires them to study harder..
Predictive analytics uses academic records and interaction data to make accurate forecasts. CareerChoiceGPS, for example, studies user personality, learning performance, and previous work experience to recommend a perfect career. MindK has developed a similar platform. It uses a sophisticated mapping of persons’ values, interests, and preferences to help them navigate life.
AI analytics can provide different content, activities, and feedback for each learner. It can automate assessment, create personal learning plans, and answer student questions.
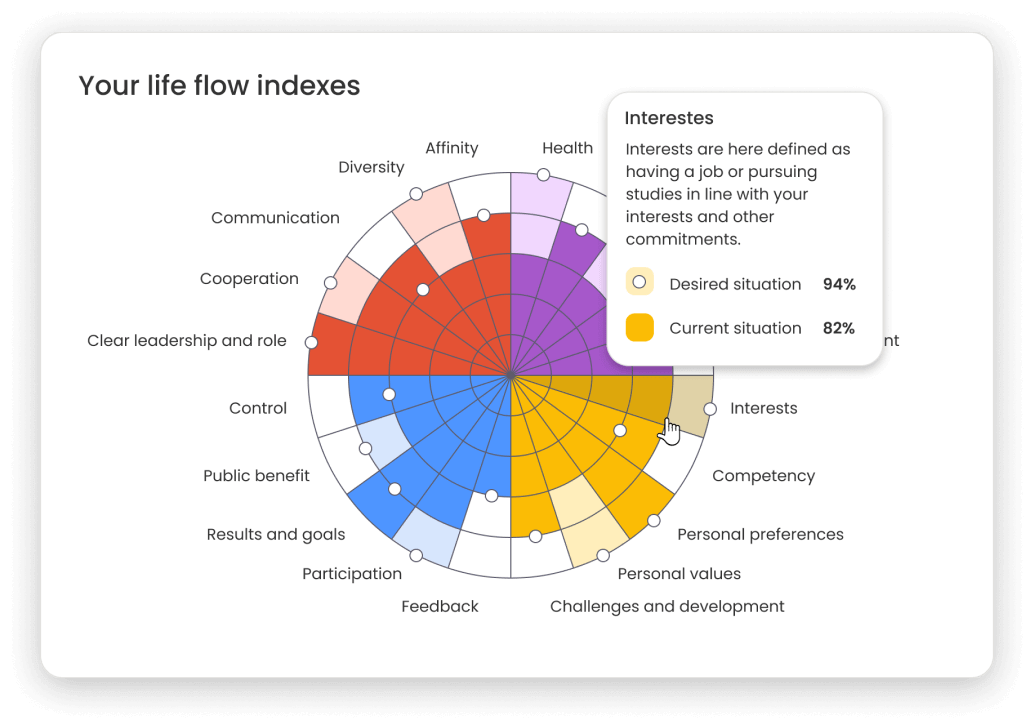
Radar chart in eLearning solution created by MindK
4. Visualization
The challenge is making use of the data once you have it. eLearning applications produce huge amounts of heterogeneous data. So you need various charts and graphs to present complex information clearly:
- Bar graphs
- Column charts.
- Line graphs.
- Pie charts
- Donut charts.
- Heat maps, and so on.
All of these are available in robust data visualization libraries like Highcharts. MindK used it for line charts, pie charts, area charts, bubble charts, heat maps, and radar charts in various apps. D3.js is another library we can vouch for. It’s a perfect choice for visualizing social connections as graphs. For standard cases, you can use Canvas, Tableau, or Microsoft Power BI integrations.
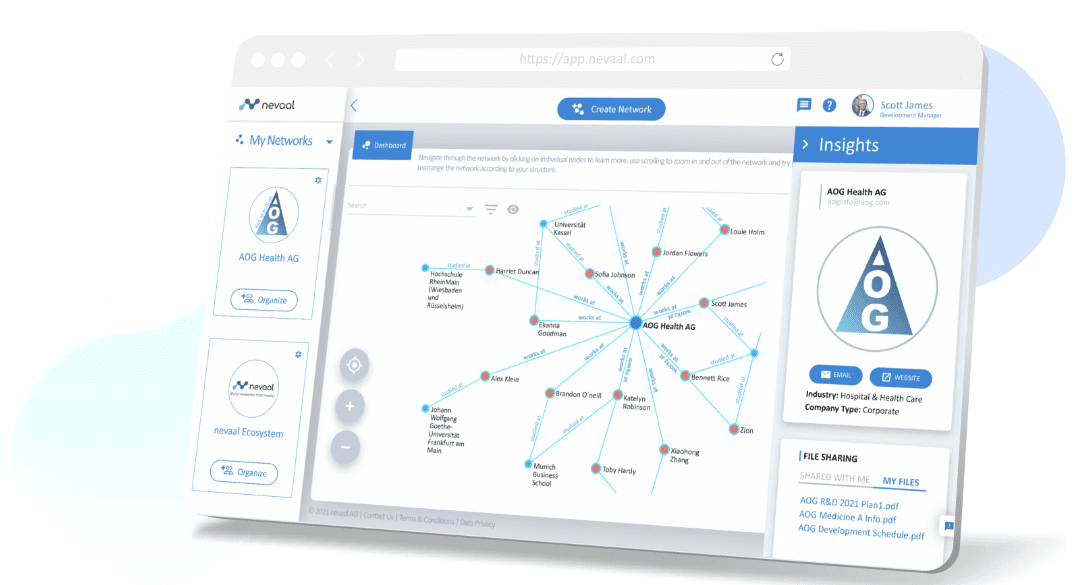
D3.js graphs in the Nevaal app created by MindK
5. Real-time reporting and personalization
Data stored in an LRS rarely comes in a user-friendly format. It’s typically ungrouped and there’s just too much of it. To create LMS reporting features, MindK has to carefully investigate the types of data that need to be displayed for each role in a client’s system:
- Administrators – system performance, user activity, and overall platform usage.
- HR managers – employee progress by role, their skills development, and ROI.
- Course creators –engagement, content effectiveness, and learner interactions.
- Individual students – personal progress, strengths, and weaknesses.
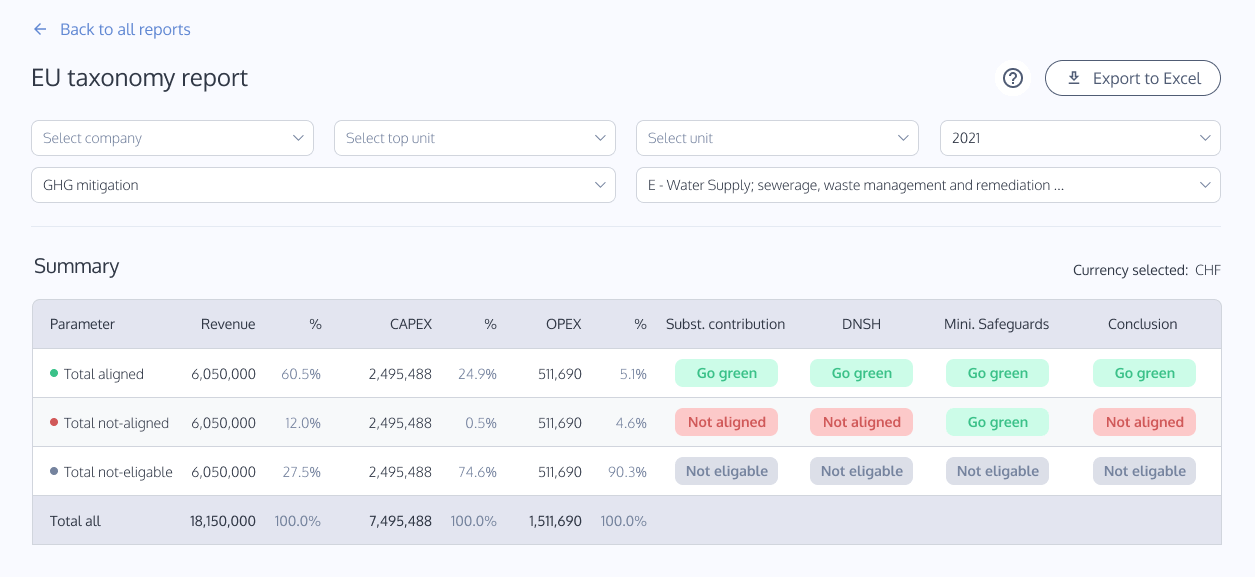
A custom report in a CSR solution developed by MindK
How to implement education analytics
MindK has been building educational software for more than a decade. This is a lot like playing with LEGOs. Modern solutions often consist of loosely connected modules, both custom and readymade. You need to select the correct blocks and properly connect them. But first, you must understand what you want to build.
1. Define your requirements
Nearly 39% of projects fail because of a faulty requirements-gathering process. Not all educators have experience with software development. So they might struggle with system requirements.
One of the techniques we use at MindK to help such clients is product discovery workshopping. It involves key stakeholders from the customer’s side as well as a Business Analyst, Tech Lead, and Project Manager from our side.
One of the key things required at this stage is to define the types of educational content in your system.
- Will you only offer individual courses or sequences of courses?
- How much interactivity is needed in your content?
- What types of LMS reporting do you want to see in your app?
- How granular do they have to be?
By asking such questions, a product team can form requirements for your system.
2. Map the requirements to system modules
A LEGO-like service-based architecture is scalable, stable, and faster to develop. If your requirements change or hosting becomes too expensive, you can easily swap components without disrupting the UX. As outlined in our guide to LMS development, modern eLearning solutions often have the following modules:
- Content authoring.
- Data storage (LRS).
- Education content player.
- Ecommerce module.
- Analytical dashboard.
Depending on your requirements, we can recommend API integrations to save costs and development time. This includes AI, Human Resources, CRM, payment, accounting, assessment, and evaluation integrations.
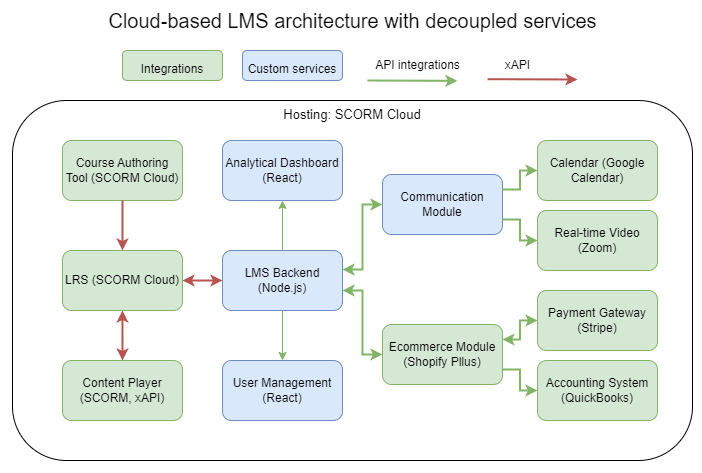
An example of modular architecture for a custom LMS
3. Select the best out-of-the-box and custom solutions
Next, we evaluate which type of modules will be a better fit for the client’s requirements. The main things to consider are the budget, timeline, scalability, and the level of customization required.
Another important thing is to choose between cloud and self-hosted options.
For example, cloud solutions like SCORM Cloud have a lot of benefits. However, they become pretty expensive with a large user count. Self-hosted solutions like Moodle and TalentLMS can be cheaper. Storing user data in the country of residence makes it easier to comply with GDPR and other regulations.
4. Develop and integrate the necessary modules
This is the point where all the LEGO pieces fall together. Depending on your requirements, the team implements the planned architecture, purchases the necessary licenses, develops custom logic, and integrates it all together.
At MindK, we work in 2-week iterations that end with a demo for the stakeholders. We then collect feedback and adjust the plans together with the client.
Privacy and security is a critical factor. For example, if you need to comply with GDPR, we could avoid passing the user’s personally identifiable information (PII) to the data storage. The system would rely on anonymized IDs that could be mapped to the user’s name or email. Other security measures could include multi-factor authentication, robust encryption, and access controls.
5. Adopt the analytics to generate insights and take actions
Having newly created analytical capabilities is just half of the job. You’ll need to integrate them into the workflows and teach employees how to use them.
MindK provides the necessary training and support to help clients adopt data-driven solutions. It ranges from defining the correct KPIs for each role to using the data in a secure way. We also help our clients collect feedback to improve their analytical capabilities.
Conclusion
Online learning analytics can be a valuable addition to your product, whether you’re building an LMS or a K-12 app. Providing valuable insights, improving learning outcomes, and driving business growth are just a few benefits of a data-driven approach. And to realize these benefits, you need a skilled development team with expertise in LMS reporting and analytics.
MindK has over a decade of experience in building solutions for the education industry. We build web applications, mobile apps, SaaS products, and API integrations. So drop us a line if you need any help.