

Header Images

Data Visualization Services

In a fast-paced environment, it’s easy to get overwhelmed by spreadsheets and data tables. When employees struggle to make informed decisions, you lose precious time and market opportunities. So, let’s transform your data into actionable insights.

What is the cost of poor data analytics?

A whole host of issues can hold you back from getting maximum value out of your data. Here are the challenges you can solve with our data visualization services.

Decisions based on misinterpreted data

Non-technical stakeholders find it hard to understand data in spreadsheets and tables. They can misinterpret the story behind your data, leading to poor decisions at various levels.

Slow response to changes

Without real-time visualization, responding promptly to emerging trends or issues is much more difficult. Slow decision-making is often the difference between market leaders and laggards.

Missed opportunities of value

Traditional data formats can limit the depth of your insights. We help companies uncover hidden patterns, trends, and correlations with powerful visualizations, filtering, and custom reporting.

Overloaded reports and cluttered dashboards

Dashboards can easily overwhelm users with a plethora of options and visual clutter. We tailor analytics and reports to the needs of each user role for ease of understanding and fast decision-making.

Data visualization services we provide

Since 2009, MindK helped SaaS and enterprise clients make data-driven decisions with data visualization and reporting dashboards. You can choose the exact services that match your business needs.

Data visualization consulting services

We analyze the state of your software and propose a solution that offers better scalability, complies with modern business requirements, and lowers your TCO.

Data visualization goal-setting
Selection of tools & platforms
Data analytics & visualization audit
Learn more

Data preparation and integration

Consistent and high-quality data is the foundation of effective visualization. MindK has vast expertise in integrating data from multiple sources. We organize enterprise storage and prepare data for analysis.

ETL (Extract, Transform, Load) process
Data warehousing
Real-time data processing
Learn more

Custom dashboards and reporting

Let your data tell the story with custom dashboards and reports designed specifically for your business. Our data visualization dashboards provide insights at-a-glance to everyone in your company – from the C-suite to low-level management.

Strategic dashboards for your C-suite
Operational reporting for department leads
Tactical dashboards for mid-level managers
Learn more

Tableau/Power BI integration & migration

Transition to industry-leading data visualization platforms. Our engineers will integrate your solution with Power BI or Tableau dashboards while preserving your existing data integrity.

BI platform selection
Dashboard integration
Training and support
Learn more

Data visualization optimization

Fine-tune your existing visualizations for peak performance. We can optimize the entire analytics process – starting with data sources, data models, visualizations, reporting, and data environments.

User feedback analysis
UI/UX redesign
Solution re-engineering
Learn more

Unlock the potential of your data for better decision-making. Request a free, non-obligation consultation with our experts today.

Customer success stories

Explore select data visualization case studies from more than 170 projects we finished for our customers.

  • CEMAsys (Norway)

    Sustainability reporting for Forbes Global 2000 companies

    Environmental, Social, and Governance (ESG) SaaS platform

    A leading ESG consultancy tasked MindK with building an all-in-one sustainability reporting platform. We developed a SaaS application with a microservice architecture and advanced analytics. It automates data collection across the supply chain, visualizes data on various dashboards, and simplifies reporting for different roles and purposes.

    • Central dashboard with 32 graphs and charts (pie, donut, bar, line, stack, and more). 
    • 33 reports with a variety of filters for different roles.
    • API gateway and integrations with external systems.
    • 800+ corporate clients that use CEMAsys for reporting.
  • Aim Analytics (USA)

    First-in-class direct-response ad analytics platform

    Custom web application

    Converze Media is one of the top direct-response ad agencies in the USA. It needed advanced analytics to track the effectiveness of campaigns across the web, TV, radio, and streaming services. MindK built a unique tool that collects granular data from various sources. It parses hundreds of broadcast logs daily, tracks website visitors, and provides granular analytics for each campaign.

    • 21 graphs, heat maps, and various charts for easy analytics.
    • A large number of report options with smart filtering.
    • Universal parser and 3rd-party integrations (BVS, Media Monitors, etc.).
    • 100s of hours saved weekly by automating manual data collection and analysis.
  • Nevaal (Germany)

    Business network analytics and visualization

    Custom FinTech application

    MindK developed an innovative solution that helps investors evaluate the potential of startup teams. The application analyzes their professional networks and visualizes connections as animated graphs. The solution won the Excellence award from Deutsche Bank and Atos in the female-fintech competition and the Fintech Germany Award nomination.

    • Dynamic relationship network visualization using D3.js.
    • Graph database storage (ArangoDB).
    • 2 pilot projects with the top 5 German Banks.
    • 500 businesses joined the platform.
    • 1
    • 2
    • 3

    Our tech stack

    MindK is tech-agnostic when it comes to interactive data visualization. We select the best tools and framework for each particular project and organization's needs.
    • Microsoft Power BI Microsoft Power BI
    • Tableau Tableau
    • D3.js D3.js
    • Chart.js Chart.js
    • Highcharts Highcharts
    • React React
    • Angular Angular
    • React Native React Native
    • Next.js Next.js
    • Express.js Express.js
    • PostgreSQL PostgreSQL
    • MongoDB MongoDB
    • ArangoDB ArangoDB
    • Amazon Web Services Amazon Web Services
    • Microsoft Azure Microsoft Azure
    • Google Cloud Platform Google Cloud Platform

    Our process for data visualization services

    You can expect high transparency and care when working with our data visualization company.

    Intro consultation with NDA

    Our specialists will contact you within 24 hours of your request to set up the first meeting. We'll then delve into your business challenges, data infrastructure, and goals for the future.
    01

    Solution design

    With your requirements in hand, we'll design an optimal data visualization solution for your company. It might involve connecting your system to an out-of-the-box visualization platform or designing a user-friendly dashboard from scratch.
    02

    Dashboard development/integration

    Our engineers will implement the chosen solution using the Agile methodology. You can expect rapid iterations and professional Quality Assurance to ensure the solution works as intended and has no bugs.
    03

    Ongoing support and training

    Our data visualization company will maintain your system for as long as necessary. If needed, we can introduce new features, refactor your code, or provide ongoing training for your team.
    04

    Charts and graphs for every occasion

    Whatever your data, we know the best way to extract helpful insights in each situation.

    Bar graphs

    Pie charts

    Line charts

    Scatter plots

    Radar charts

    Bubble charts

    Histograms

    Heat maps

    Dot plots

    Connectivity charts

    Sparklines

    Funnel charts

    Area charts

    Donut charts

    Custom graphs & charts

    14 years of industry expertise

    MindK has been building data visualization solutions for various niches since 2009. This expertise allows us to deliver results faster and more efficiently.

    Choose your service option

    To fit various companies' needs, MindK offers several engagement models.

    Why MindK

    We combine T-shaped expertise with cloud-native technologies and 14+ years of experience in FinTech, Healthcare, Recruitment, and other industries.

    Engineering excellence

    MindK hires the best engineers on the market. Only 4 in 100 experienced candidates have the soft & hard skills to join us.

    01

    Industry expertise

    Access our vast expertise in Healthcare, FinTech, Real Estate, HR, Advertising, Sustainability, and other industries.

    02

    Proven track record

    Since 2009, MindK has delivered over 170 complex web and mobile projects on time and within the client's budget.

    03

    96% customer satisfaction

    Most clients continue working with us for 5 years, recommending MindK to partners and peers.

    04

    What
    our
    clients
    say

    • Philip Yancey

      Philip Yancey

      Partner at Converze Media,
      USA

      Philip Yancey

      A reliable partner

      «I appreciate how MindK was able to build such a platform from conference calls, emails and basically a wish list of what our company wanted and needed automated to make Converze a more efficient and effective player in our space.»

    • Zaheer Mohiuddin

      Zaheer Mohiuddin

      Co-Founder, Levels.fyi
      USA

      Zaheer Mohiuddin

      This isn't your typical outsourcing shop

      «The quality of work and the interactions with the team felt akin to anyone that I've worked within the Bay Area in technology. MindK's expertise is for real and the bar is high. This isn't your typical outsourcing shop, MindK has top-notch engineers and PMs.»

    • Per Otto Larsen

      Per Otto Larsen

      Head of CSR Services, CEMAsys.com
      Norway

      Per Otto Larsen

      High level of detail
      and thoughtfulness

      «The level of detail and thoughtfulness of what they deliver is so good, that a simple explanation of the next idea serves as the basis for them to take it and turn into reality. MindK’s support allows us to focus on core business, product growth and our customers’ needs.»

    • Jesse Raccio

      Jesse Raccio

      CTO, The Game Band
      USA

      Jesse Raccio

      The team is always there to dig in and help

      «I’m happy with MindK’s agility, which relates to their communication. If we need to pivot on something, they’re ready to go in a different direction, and it doesn’t take a lot of energy to move that ship. The team is always there to dig in and help us out when we need to understand anything. Overall, they’re really supportive.»

    • Jordan Crone

      Jordan Crone

      Chief Experience Officer, Melody
      USA

      Jordan Crone

      Smooth
      communication flow

      «Our project has been going smoother than I could have imagined... It's the first time I've worked with a dev team a distance away that didn't have major (or any, for that matter) hiccups or have things lost in communication. I wish we could snatch them and make them a part of our team.»

      More services for your needs

      MindK is a full-cycle software development company with a focus on cloud-native technologies and Agile delivery.

      Get started with our data visualization services

      Tell us about your data challenges. We'll get back to you within 24 hours
      to schedule your free consultation and sign an NDA.

      Our approach

      LMS reporting and analytics

      LMS Reporting and Analytics: a 5-Step Approach to Data-Driven eLearning Software

      Read more
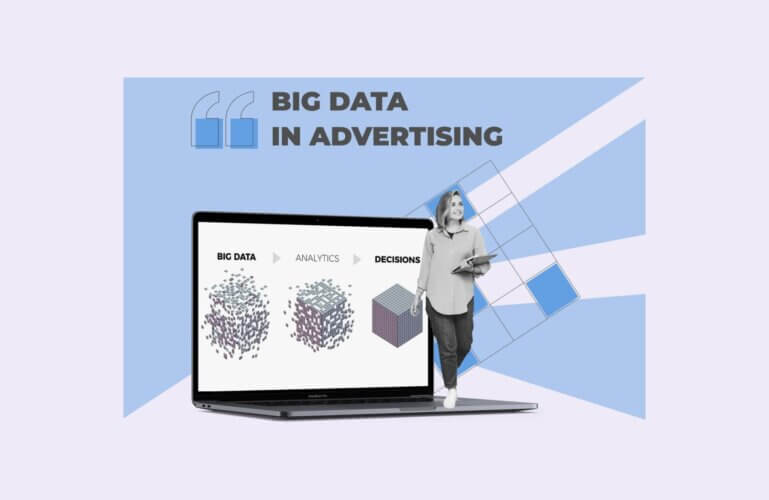
      Big Data in Advertising: How AdTech Is Changing

      Big Data in Advertising: How AdTech Is Changing

      Read more
      key to digital transformation

      Data in Digital Transformation: 3 Key Steps to Business Value

      Read more

        FAQ

        • What is data visualization services?

          Data visualization uses graphical representations and visual tools to transform complex data into easily digestible insights. Creating charts, graphs, dashboards, and interactive visualizations helps organizations make informed decisions, identify trends, and communicate data-driven insights effectively.

        • How do I get started with your data visualization services?

          It’s as simple as reaching out to us for a consultation. We’ll guide you through the process from there.

        • What kind of data can you visualize?

          We can visualize a wide range of data types, from structured to unstructured and geospatial data.

        • How long does it take to develop a data visualization solution?

          The timeline varies depending on the complexity of your project. We’ll provide a detailed estimate during the consultation.

        • Do you offer ongoing support?

          Yes. We provide comprehensive support and maintenance to ensure your data visualization remains effective and up to date.

        • Which service is used for data visualization?

          Common data visualization tools include Tableau, Power BI, D3.js, Highcharts, and Chart.js. These tools offer various features and capabilities for creating informative and interactive data visualization tailored to specific business needs.

        • What is data visualization as a service?

          Visualization as a Service (VaaS) provides on-demand access to BI visualization tools and capabilities. It allows organizations to forgo investing in or maintaining their infrastructure. VaaS enables businesses to quickly create, share, and analyze visual data representations.

        • What do custom data visualization do?

          Data visualization firms like MindK help businesses transform raw data into visual formats. These services offer several key functions:

          • Data exploration to visually uncover trends, patterns, and outliers.
          • Insight communication between stakeholders and departments.
          • Support for data-driven decisions with actionable information.
          • Real-time monitoring to track key metrics and respond to changes promptly.
          • Data integration from various sources, databases, and other tools to ensure up-to-date and accurate visualizations.

          In summary, data visualization service transforms data into visual representations that enhance understanding, inform decisions, and drive business growth.

          Solve your data visualization
          challenges

          Send us a request with a brief description of your challenges and we'll
          contact you within 24 hours to sign an NDA and arrange your free consultation.

          Drop to attach file

          Thank you,
          your message has been sent successfully!

          We’ll contact you within the next 24 hours. In the interim, you can take a look at our portfolio or check us out on Facebook, LinkedIn, Twitter or Instagram.

          Ok